Map of the PickCells user interface
Contents
PickCells screens
The PickCells window displays four main screens, which are depicted in the diagram below:
Navigation between each screen is via the icons which are located at the bottom-left of the PickCells window, which match those shown in the diagram above:
![]()
The Log off icon closes the user screen or workbench and returns you to the welcome screen.
Welcome screen
The welcome screen provides general information about PickCells.
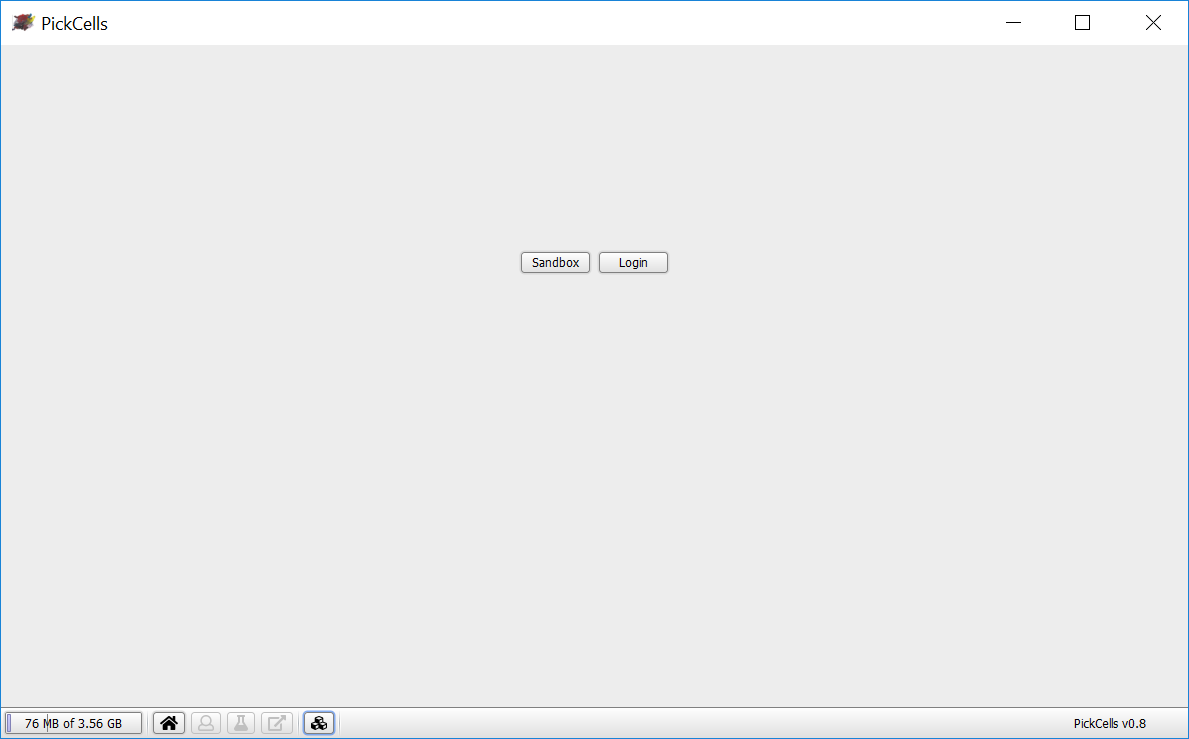
From the welcome screen, you can:
- Click Sandbox to go to the sandbox.
- Click Login to login. Once logged in, you will be taken to the user screen.
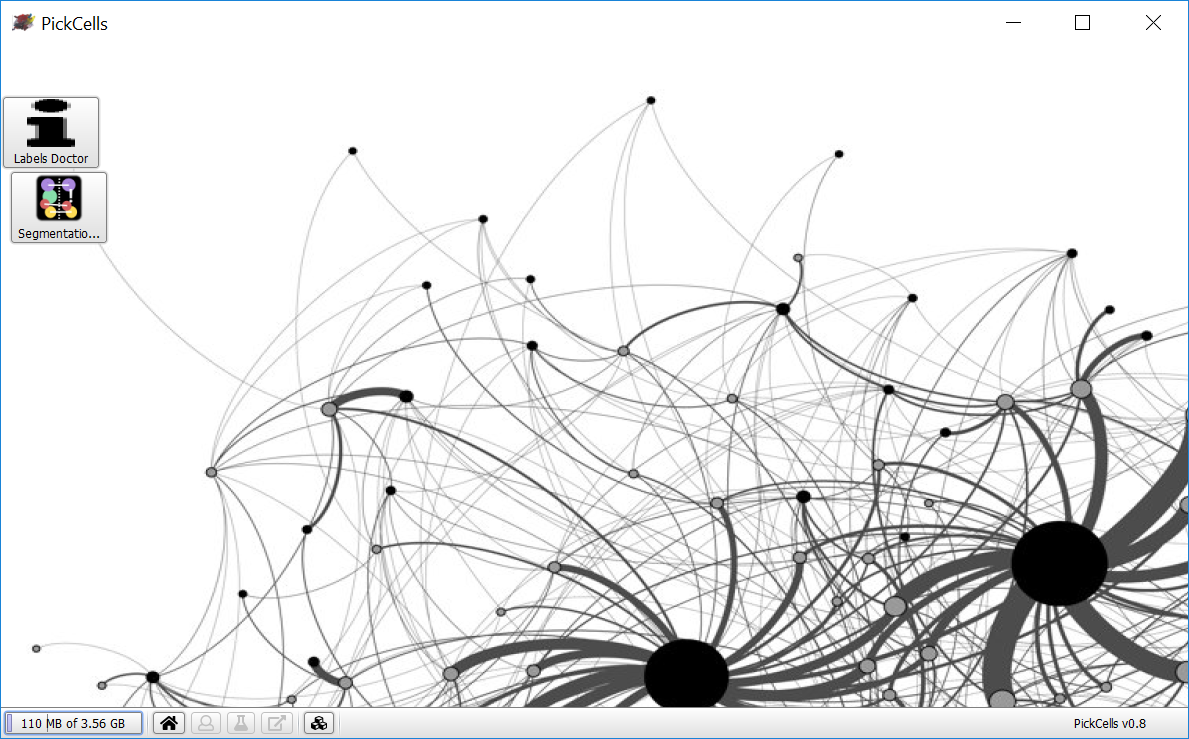
Sandbox
The sandbox provides you with access to a collection of tools for image processing and visualisation. These are generic tools and don’t extract any specific data or update your experiment database.
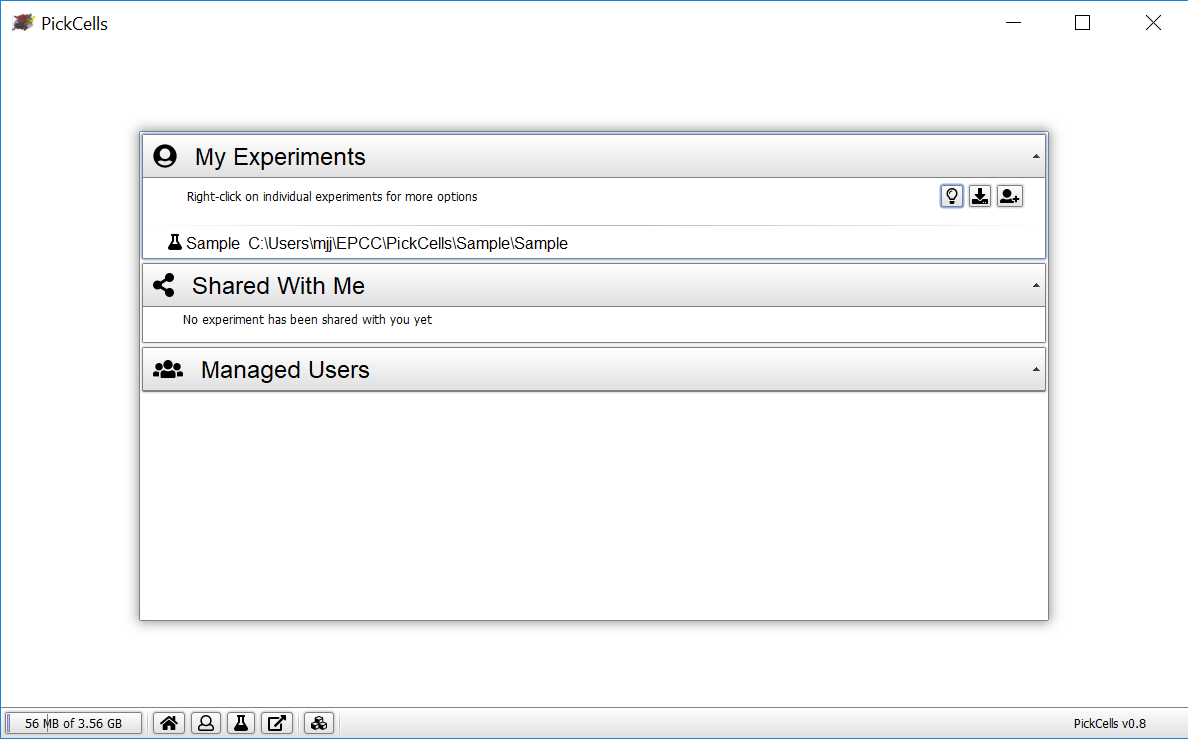
User screen
The user Screen is where you manage experiments (create, delete, share, …). If you are an administrator, this is where you can also manage other users (add, remove, …).
For more information, please see:
Workbench
The workbench is the heart of PickCells. When you load an experiment, a corresponding workbench is opened. Each experiment’s workbench provides you with a view of the metadata of that experiment, and allows you to carry out myriad analysis and visualisation tasks.
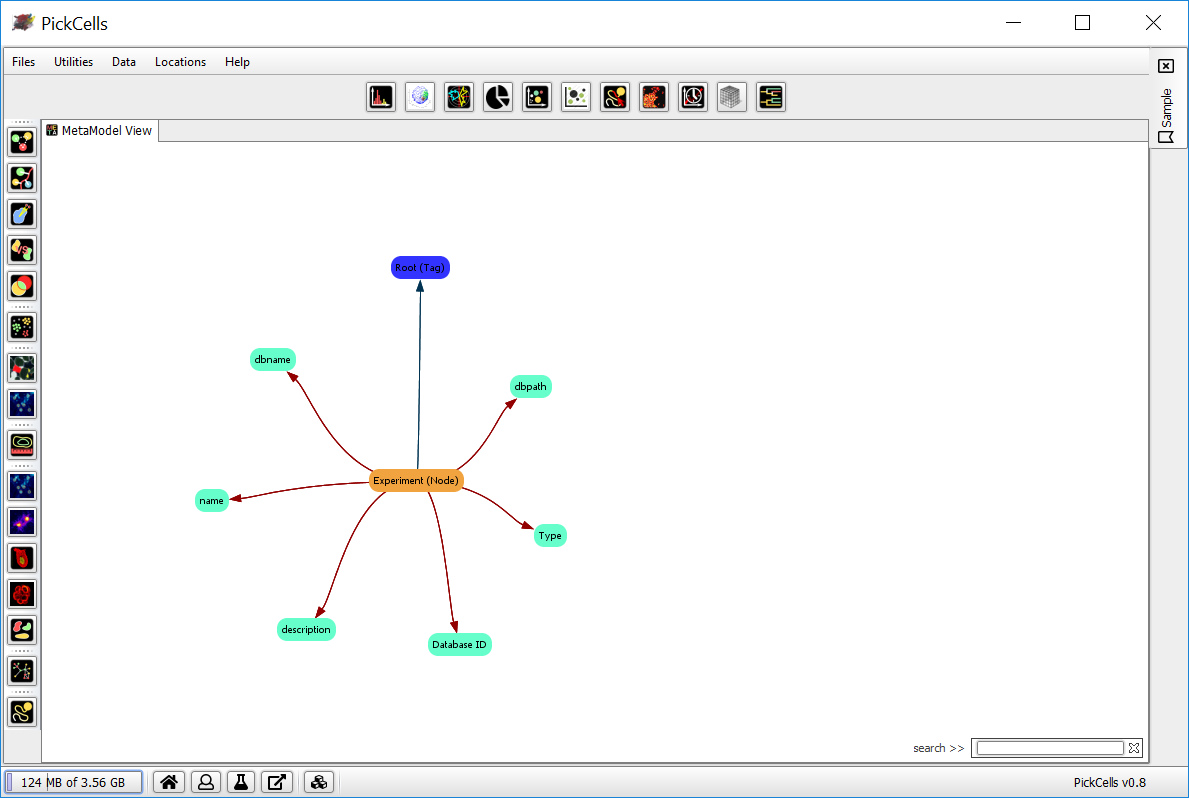
The key components of the workbench include:
- Analysis modules: The icons on the left-hand side provide access to analysis modules. There is one icon for each module.
- Click on an icon to open the corresponding analysis module.
- See Modules for more information on each module.
- Visualisation modules: The icons along the top provide access to visualisation modules. There is one icon for each module.
- Click on an icon to open the corresponding visualisation module.
- See Modules for more information on each module.
- MetaModel View: a visualisation of the current state of an experiment, as held within the database. This shows the experiment’s objects and the relationships between these.
- Click on a node to centre the view on that node.
- Right-click on a node to open a popup menu which allows you to get more information about the node or delete the associated object.
- Enter text into the search box to highlight nodes whose names match that text.
- Loaded experiments: the tabs on the right-hand side show the currently-loaded experiments.
- Click on a tab to view the workbench for the corresponding experiment.
Status bar
At the bottom of the PickCells window is the status bar:

The status bar includes:
- Heap status: Indicates how much heap (or memory) PickCells is currently using. In the above example, ‘124 MB of 356 GB’.
- Navigation icons: to navigate between screens, as described above in PickCells screens.
- PickCells version number.