Nessys
Content
- Description
- Notes on image quality
- Walk-through video tutorial
- How to adjust parameters
- Images larger than 4GB
Description
Nessys (Nuclear Envelop Segmentation System) is a module for the automated segmentation of nuclei in fluorescence images. It can handle 2D, 3D, and time lapse datasets.
Important: Nessys uses the signal of the nuclear envelope in order to identify nuclei. With such labeling, Nessys is particularly well suited for dense, heterogeneous and overlapping nuclei. Note also that although Nessys has not been designed for Dapi or Hoescht stained nuclei, it may still give satisfactory results when nuclei are not too densely packed or not too textured.
-
This page will help you learn how to use the module. For an in depth description of the method please refer to our research article in Plos Biology. If you find this tool useful for your research, we would be very grateful if you could cite our work:
Nessys: A new set of tools for the automated detection of nuclei within intact tissues and dense 3D cultures
Guillaume Blin, Daina Sadurska, Rosa Portero Migueles, Naiming Chen, Julia Alice Watson, Sally Lowell
PloS Biology, 2019, doi: https://doi.org/10.1371/journal.pbio.3000388 -
The module is readily available in PickCells but it also comes as a stand-alone application. Please follow instructions in the code repository if you wish to use the stand-alone version.
Notes on Image Quality
Image quality is critical to get right for image quantification purpose. It is essential to properly adjust image acquisition parameters with the analysis application that needs to be performed in mind. The choices of acquisition parameters depend on the balance between image disk size, acquisition time, sample viability, photo-bleaching and the required image quality.
Below is a list of image properties that are strongly recommended for Nessys segmentation :
-
Bit depth : 16 bits. This is a very important parameter, almost obligatory. This defines the number of gray values that each voxel can code. The difference for the eye may be null but it makes a huge difference to the computer.
-
XY resolution : 0,1 µm – 0,6 µm. The denser and elongated the cells are, the higher the XY resolution should be. Both accuracy and segmentation time will increase with resolution.
-
Z-step size : 0,1 µm – 2 um. Nessys first segments each z-slice independently and then links 2D segmented shapes into 3D objects. The smaller the z-step the more robust the segmentation will be. Larger z-step sizes are acceptable when cells are not flat (3D culture, embryos), however, for 2D culture it is recommended not to go above 0,5 µm.
Walk-through video tutorial
The following video provides a step by step guide on how to segment the sample image available for download on our owncloud server (password is ‘nessys’).
How to adjust parameters
The following sections describe parameters for each individual steps in the Nessys pipeline and provides advice on how to properly adjust parameters for a new set of images. It assumes that you have watched the video tutorial above and/or that you are running Nessys as you follow this guide.
Denoising
An optional denoising step has recently been added to the segmentation pipeline.
This step is useful if the signal to noise ratio of the image is low. For example, applying a Gaussian filter to the image below may help the segmentation:
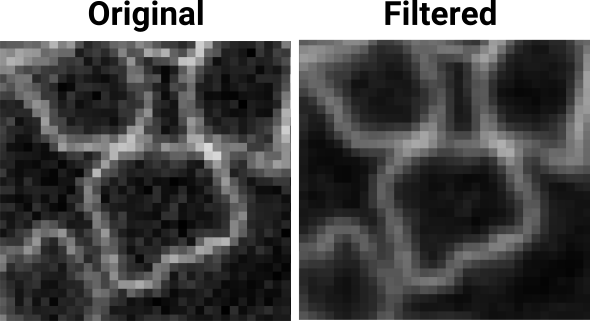
NB1: Gaussian blur does not preserve edges very well so when applying this filter, use radii that are lower than 1. For the above image a value of 0.7 was used in all directions.
NB2: If the image is of good quality, it is preferable to skip this step by selecting ‘skip’ in the ‘Available methods’ dropdown list.
Ridge Enhancement
This step consists in smoothing and enhancing nuclear contours. A complete description of the algorithm used for this step and of the parameters effects can be found in (Jacob and Unser, 2004).
- Staining type : Choose ‘Nuclear Content’ only if nuclei need to be identified based on a nuclear marker such as Dapi, Hoescht or H2B-FP. Otherwise, choose ‘Nuclear Envelope’. A nuclear content type of signal will work for cells which are relatively well separated even if the population of cells is heterogeneous in size and shape. However if the cells are very dense, it is highly recommended to use a nuclear envelope signal.
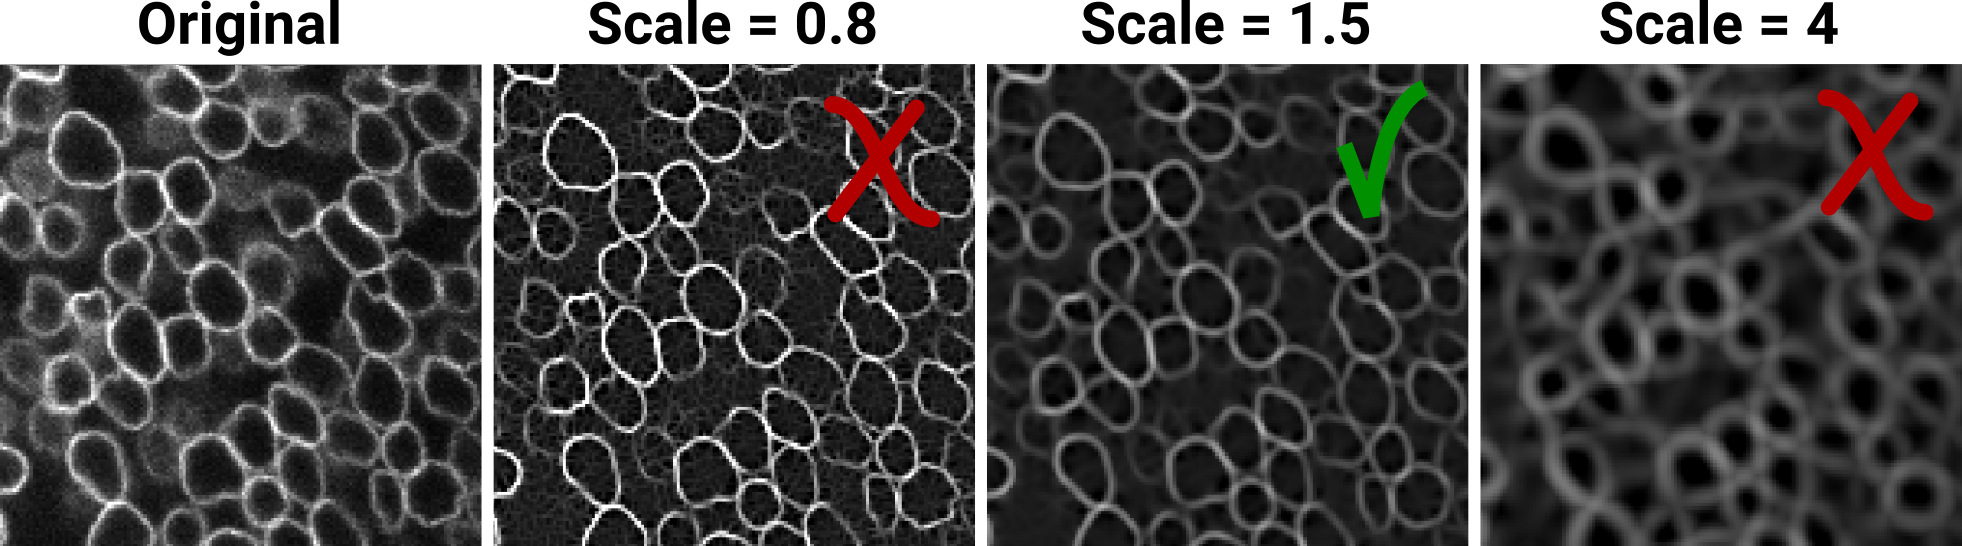
- Scale : Should be approximately the width of a ridge (in pixels), see the example below.
- Quality : High will be more sensitive to straight ridges but tends to create artefacts where ridges cross one another. Normal is the default and generally provides satisfactory results.
Example of expected results at this stage:
Note how the noise in the image becomes apparent as tiny ridglets when the scale is too low (scale = 0.8). When the scale is too high (scale = 4), the contour of the nuclei look blurred and widened. In this case a scale of 1.5 gives a good compromise.
Reference
Jacob, M., and Unser, M. (2004). Design of steerable filters for feature detection using canny-like
criteria. IEEE Trans. Pattern Anal. Mach. Intell. 26, 1007–1019.
Slice by slice segmentation
This step consists in identifying cell areas on each z-slice of the image. This can be divided into 3 sub-tasks:
- Identify intensity maxima in the image. These maxima are used as the ‘origins’ for tracing the contour of individual nuclei.
- Trace the contour of nuclei : Staring from a maximum, this process follows the ridges in the vicinity to create a ‘trace’.
- Rank shapes : Once a trace is constructed, multiple shapes maybe defined from it. At this step, the user trains a classifier to define which shape defines a valid nucleus.
Maxima Detection
This step consists in identifying locations in the image where bright ridges can be found. As mentioned above, these maxima are then used as the ‘origins’ for tracing the contour of individual nuclei. Therefore, the number of maxima will dictate how many attempts will be done to identify a new shape in the image. The higher the number of maxima, the longer the segmentation time but the more likely all the nuclei will be found.
Maxima Threshold : To adjust this threshold, find the dimmest cells and try to obtain 2-3 maxima per cell (located on the ridge of the nucleus). Increase the threshold when too many maxima are detected in the background, decrease the threshold when some cells do not have maxima.
Contour Detection
This step (called ‘Ridge Segmentation’ in the interface) is the step which takes the maxima identified previously and attempts to trace the contour of individual nuclei.
Adjust the parameters in the following order:
-
Max radius : Find one of the largest nucleus in the image and adjust the max radius until the nucleus can be detected. Try to use the smallest max threshold to avoid long computation time - the larger this threshold the longer the computation will take.
-
Min radius : Find a small nucleus region and proceed as for the max threshold, try to find the largest min threshold to avoid false detection rate (spaces between nuclei for example).
-
Search Radius : The tracing process is incremental, this parameter represents the size of this increment in pixels. It is generally not required to adjust this parameter. This should only be adjusted with high resolution images where ridges are more than 3 pixels wide.
-
Delta : It is generally not required to adjust this parameter. You may try to adjust this parameter only if nuclei are not accurately identified even after training a custom classifier (see next step ‘Shape ranking’). This threshold is a percentage of the initial intensity found at the start of the trace, when this minimum intensity threshold is reached, the contour tracing stops. Delta defines this percentage (for example : 0.1 = 10 %).
Shape ranking
This step consists in telling Nessys which detected shapes are indeed nuclei and which shapes are incorrect (space between nuclei or half of a nucleus for example). In other words this step makes you train a classifier so that wrong shapes are eliminated from the final result.
A classifier is provided by default (E70_Classifier), however it is often required to train a new classifier to obtain optimal results.
- If you have not generated shapes with the default classifier, click on ‘Generate Shapes’. The generated shapes will depend on the contour detection parameters used (see above). This will draw shapes in the ‘annotation’ channel which can then be selected (right click) to train the classifier.
- To train the classifier, you need to select at least 10 shapes for each class (valid and invalid). Once 10 objects of each have been selected, you can click on ‘Create Best Guess’ in order to preview what the final result will look like.
- After checking that the new classifier gives satisfactory results over several z-sections, you can save the classifier to file for future use.
- Choose a broad range of shapes for each class in order to provide the classifier with a representative selection. For valid shapes, it is best to select the smoothest shapes which follow well the contour of the nuclei. For Invalid shapes, we recommend to focus the selection on shapes found in between inter-cellular spaces and shapes containing corners.
- Do not be too stringent as this might lead to cells being « missed ». It is not required to obtain a perfect segmentation at this stage (although the more accurate, the better) since the 3D linkage step (see below) can compensate for segmentation errors occurring at this step.
- The ‘Highlight Lowest Score’ can be quite useful to see which shapes are the most ambiguous to the classifier : informing the classifier on these shapes can have a bigger impact than on others.
- Check different z-sections to obtain enough shapes and observe the robustness of the segmentation.
3D Linkage
This step consists in linking the 2D areas identified in the previous step in order to obtain 3D volumes. Nessys will provide default values based on the parameters provided in the previous steps.
Basic parameters
-
Max Volume : run the linkage once and check if large cells have been split into multiple objects (in the z axis). If this is the case, it is likely that the max volume is too small. NB : You can right click on a segmented shape in order to see the volume of this shape. Do not be surprised if a volume is not within the bounds that you have defined, Nessys uses the values as an indicator but will allow lower or larger values if no alternative exists.
-
Min Volume : Find a small cell, generally dividing cells and adjust this parameter until the cell can be detected and is not either merged or deleted because it is considered as a debris. Try to find the highest minimal volume.
Advanced parameters
The 3D linkage step works by first creating a graph of potential linkages across z-sections. Each potential link is assigned with a ‘likeliness’ score which depends on the Jaccard Index (index of similarity). Once the graph is constructed. The links are ranked in descending order of their score and assigned a unique volume id. The volume id is then propagated when two ids meet, provided that the merged volume remains within bounds.
The following parameters have an impact on the creation of the graph of potential links :
- Search Radius : This is the max distance in pixels between the centroids of 2 areas (on different slices) in order to consider a potential linkage. Increase this distance when too many shapes are split and decrease this value when too many shapes are merged.
- Min Overlap : This parameter works together with search radius. If 2 areas centroids are within the search radius bounds, Nessys tests the percentage of overlap between the 2 shapes. This parameter defines the lower threshold for this overlap. Increase this value when too many shapes are split and decrease this value when too many shapes are merged.
- Allowed Slice Jumps : Default is ‘2’ which means that 1 empty slice if allowed (Connect 2 slices below first area).
There exists an additional subtlety to take into account regarding the creation of the graph of potential connections. Nessys attempts to correct for errors which occured in the previous step. Area may represent merged cells, in order to correct for this type of error, the graph creation step must allow potential links to be created between properly identified areas in one slice and merged area in the subsequent slice. The centroid distance may be relatively large in such a case. Increasing the search distance can lead to the counter-intuitive result of properly splitting an area which was a merge in the previous step. Thus in order to properly adjust these parameters one has to keep a look at the inputs of this step and check if a lot of splits or merges are present.
- Post-processing options : These options allow to split cells when they strongly overlap with one another :
- None : no further split will be attempted
- Intensities only : Nessys will look for variations of intensities which occurs within identified volumes accross z sections. A peak of intensity close to the middle of the volume will increase the chances of spliting.
- Orientation only : The centroids of areas which were linked to create a volume create a track in the z axis. A properly segmented nucleus should maintain a relatively constant direction of displacement of these centroid. A sudden change in the direction of this displacement will increase the chance of spliting.
- Both : Takes both intensities and orientations in computing the chance of splitting a volume.
- Split Tolerance : The split will be performed if the score for a particular volume is an outlier with respect to the score identified in the entire population of volumes. This value defines the threshold deviation from mean (number of sigmas) to consider a score as an outlier. Higher values will lead to fewer splits. Note: split events can be identified in the GUI by a drawn square around the cell (in the annotation channel).
Images larger than 4GB
If you are using the stand alone Nessys application and you want to segment images larger than 4GB, please refer to instructions in the README.txt file located in the root folder of the Nessys installation.